Recently, a friend of mine shared a series of highly interesting analyses that he had carried out on the percentage of canceled bookings and their relationship to a reduction in average rates for certain hotels. As I found his observations extremely relevant, I then discussed the topic with dozens of hotel managers and all, without exception, commented that they had noticed an increase in cancelation rates and the uncertainty that this represents for them.
I therefore decided to dig deeper. More specifically, I took a look at some additional data that I needed to analyze to come up with genuine solutions for this new problem.
After examining cancelation requests covering around 500,000 bookings, some trends emerged, and these could be a source of good ideas for you.
Average cancellation rates
First and foremost, let’s try to identify the real people who cancel, while drawing a few conclusions that can be used for your day-to-day management.
The average percentage of canceled reservations, across all sources, is currently 24%. Therefore, when you calculate your future revenue from existing reservations, always reduce it by 24% to have an objective estimate that leaves no room for nasty surprises.
If you look only at online bookings, this rate increases to 38%, and therefore it follows that all “offline” reservations have a very low cancelation rate of only 10%.
Breaking down the different sources of online reservations, the reality of the situation becomes clear: Booking.com remains the king of cancelations with an “impressive” rate of 57%. As for Expedia, it’s about average at 26%, while your official website is nearly as good as your offline bookings, with a cancelation rate of just 14%.
The moral of the story is clear: the more direct or offline bookings you take, the more likely you are to experience low cancelation rates.
Lead Day vs. Cancellation rates
Definition: the Lead Day is the number of days between booking and check-in.
For example, a guest who books on January 10th and who checks in on January 26th will have a 16-day Lead Day.
I wondered whether we could establish a relationship between the Lead Day and the percentage of cancelations and, indeed, the graph is quite striking:
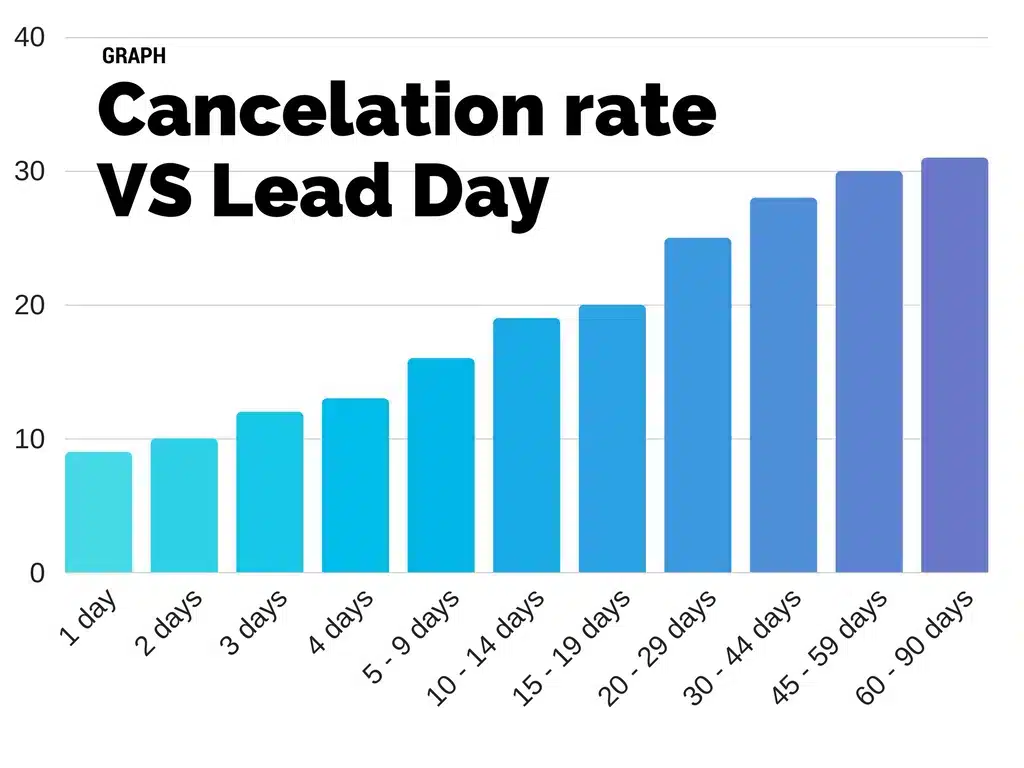
What an impressive curve!
Like all graphs, some interpretation is needed to draw relevant conclusions.
Before and after 20 days:
The first observation relates to Lead Days at or above 20 days. You will recognize that, where the guest is due to check in more than 20 days out, the prospect of a cancelation is 30%.
Only once the Lead Day drops below 20 days do your chances of retaining the guest really increase.
Within 10 days:
We record a second drop in cancelation rates for Lead Days below 10 days. This drop increases from day to day and ends up below 10% for bookings that are made on the day of arrival.
When a guest makes a booking with a Lead Day below 10 days, your chances of retaining the guest are maximized: which means that your overall revenue should not move (or at least not much).
Corollary:
It is more and more common to hear hoteliers say: “We don’t have any long-term insight and all our bookings are made at the last minute.” Perhaps it would be more accurate to express it as follows: “Long-term reservations have such high cancelation rates that you find yourself rushing around at the last minute to fill the gaps left by canceled bookings.”
This hypothesis is confirmed by one of my previous analyses, when I reached the conclusion that the average Lead Day since the start of the year was 32 days. I remember getting a lot of skeptical feedback from shocked hoteliers for whom the analysis seemed very strange. All were surprised by this figure of 32 days, because it seemed to them that all their bookings came at the last minute.
It could in fact be that the average Lead Day has not dropped, but that the increasing number of cancelations creates the phenomenon that gives us the impression that we only ever have Last Minute reservations and no long-term visibility.
In each case, this information is only analysis of data. Nevertheless, and this is the essential point, they can allow us to identify new and relevant solutions.
Highest cancellation rates by nationality
This top 10 is made up from two parts, or tables, in order to make the information more usable:
Top 10 countries giving rise to the largest number of cancelations:
My list features the countries that are the source of the largest number of bookings, sorted by cancelation rates:
| China | 47% canceled |
| Spain | 25% canceled |
| Italy | 24% canceled |
| United Kingdom | 23% canceled |
| Germany | 18% canceled |
| USA | 17% canceled |
| France | 16% canceled |
| Netherlands | 15% canceled |
| Switzerland | 15% canceled |
| Australia | 13% canceled |
The countries below are those that cause the greatest problems: large number of bookings with a significant proportion being canceled.
Top 10 countries with the highest cancellation rates
These countries are relatively minor sources of bookings, sorted by cancelation rate:
| Nigeria | 73% canceled |
| Algeria | 65% canceled |
| Egypt | 57% canceled |
| Indonesia | 56% canceled |
| Iran | 56% canceled |
| Vietnam | 55% canceled |
| Saudi Arabia | 55% canceled |
| Oman | 53% canceled |
| Thailand | 52% canceled |
| Tunisia | 52% canceled |
It is extremely important to distinguish correctly between this table and the previous one. The countries that appear in this second list will not result in “large” quantities of canceled bookings because they don’t generate that many bookings in the first place. However, each booking that comes from these nationalities is more likely to be canceled than not.
Observation on contact with guests prior to their stay
We have analyzed all guests who had been in contact with the hotel prior to their arrival. Some extremely interesting figures emerged as a result.
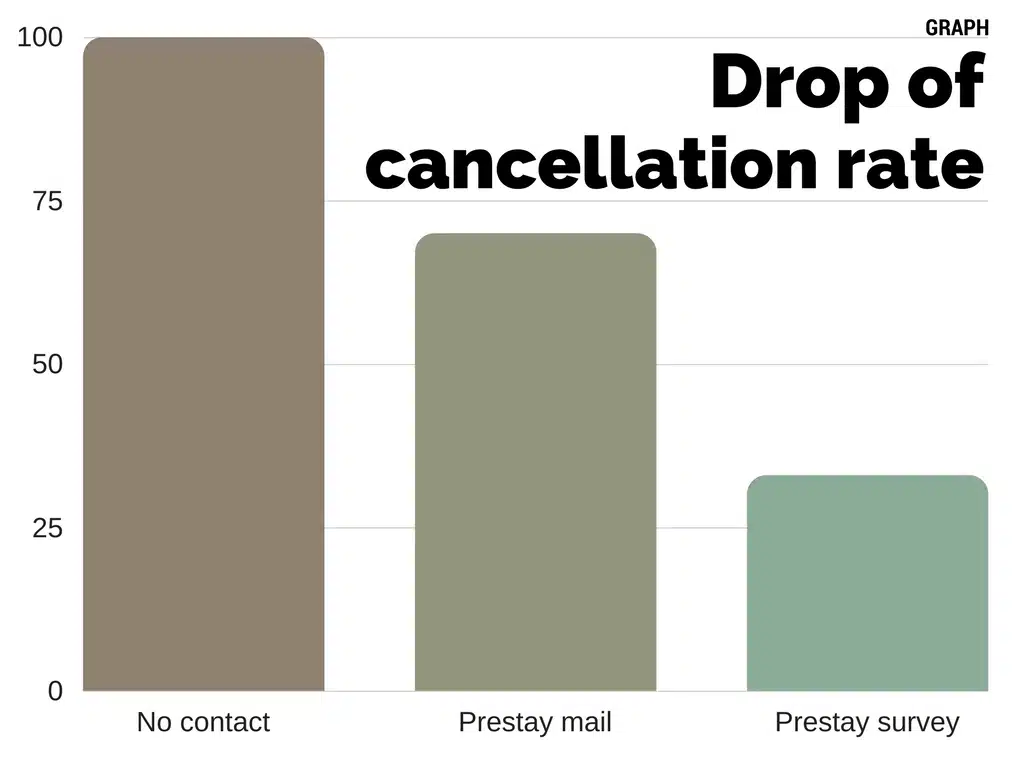
Here is what the graph means:
If the guest has been contacted by an actual person from the hotel, the chances of the reservation being canceled reduce by 30%.
But once the guest has responded to this contact, the chance of a cancelation falls even further, to only a third of the usual level.
This therefore tends to confirm the following theory:
The main cause of cancelation is the following phenomenon: guests make bookings at several hotels simultaneously, then whittle down the number of properties (following relatively arbitrary criteria) until they eventually end up with only a single booking.
When they receive a personalized message from the hotel, they realize that they are dealing with a real person, who cares about the service they receive and their well-being. The result is that two-thirds of them therefore decide not to cancel their bookings.
Do not underestimate the impact that this confirmed theory can have on your revenue.
Conclusion
These facts and figures demonstrate once again that any problem that is known and understood can be solved. By taking a real interest in cancelations, and analyzing them as a result, we can really find ways of reducing their frequency and, what’s more, these solutions already exist.
This article is just an initial analysis of the topic. I hope that others will follow in the future, which will also go into more detail about certain solutions.
Of course, as ever, if you would like to raise a particular topic on my blog, please don’t hesitate to share it with me, and feel free to discuss it in the comments below.